Average Google Ads CPC is $2.69 across all industries — but marketing keywords average $7.40. Pay-Per-Click Advertising Cost; This breakdown covers CPC by industry, average CPM, click-through rates, and how to set a realistic PPC budget.
How Much Does Pay-Per-Click Advertising Cost in 2026? Industry Benchmarks & Budget Guide
📋 Pay-Per-Click Advertising Cost; Here’s the 2026 picture in plain language, with real numbers you can use to plan your PPC budget.
Quick overview
- Cross-industry Google Ads benchmarks (Search):
- Average CPC: about $5.26; average CTR: 6.66%; average conversion rate: 7.52%; average cost per lead: ~$70 (US-based data, Apr 2024–Mar 2025).
- Another widely cited benchmark (via WordStream) reports all‑industries CPC around $2.69 on Search; the difference comes from dataset mix, geography, and campaign types (e.g., more low-CPC advertisers or regions). Expect your true CPC to likely fall somewhere between these two anchors depending on industry and targeting.
- CPM (cost per 1,000 impressions) across Google’s mix of Search/Display/Shopping/Video commonly falls in the low‑to‑mid teens, e.g.:
- Ecommerce-focused panel: median CPM ≈ $12.79 in 2025.
- Large brand dataset (incl. heavy display): average CPM ≈ $11.12; ≈ $17.80 when adjusting for outliers.
- Microsoft Advertising (Bing Ads) remains cheaper: CPC ≈ $1.50–$2.80; CPM ≈ $6–$9; CTR ≈ 2.8% (2026).
- Management/agency fees typically add another 10–20% of ad spend (or a flat fee on top), which you must factor into your total PPC budget.
Pay-Per-Click Advertising Cost; Use the ranges below as reality checks, not guarantees — your actual CPC, CTR, CPM and CPA will depend on your industry, country, and how well you execute.
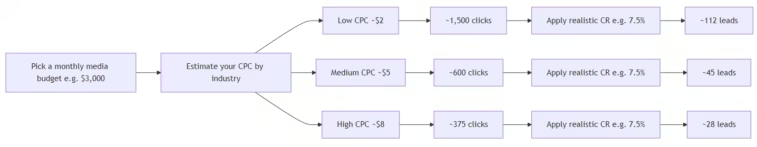
Mermaid snapshot: how to think about budget vs CPC
Pay-Per-Click Advertising Cost; This diagram shows how a modest monthly budget translates into clicks and leads at different CPC levels (illustrative).
1. What “average” PPC costs in 2026 (and why the numbers differ)
Pay-Per-Click Advertising Cost; You’ll see two families of “average” CPC figures in circulation:
- Higher anchor (~$5.26):
- WordStream/LocaliQ (16,000+ US campaigns, Apr’24–Mar’25): CPC $5.26, CTR 6.66%, CVR 7.52%, CPL $70.11.
- A 2025 multi-vertical analysis confirms CPC in this range and notes costs are rising year over year.
- Lower anchor (~$2.69):
- A widely referenced summary pegs “average Google Ads CPC across all industries” at $2.69 for Search (and ~$0.63 for Display) in 2026, again sourced from WordStream data but with a different geography or advertiser mix.
Both are “real.” The $5.26 figure reflects a dataset skewed toward small- and medium-business US search advertisers; the $2.69 figure likely includes more low-CPC industries and/or broader mixes (including more display and different regions). For planning, assume:
- Expect to pay more if you’re in:
- Legal, finance/insurance, dental, home improvement, education — often CPC $5–$9+.
- Expect to pay less if you’re in:
- Arts & entertainment, travel, restaurants, real estate, autos-for-sale — often CPC $1.6–$3.
Rule of thumb: Start with a CPC range for your industry (see next section), then use your own first 30–60 days of data to refine it.
2. CPC benchmarks by industry (2025–2026)
Google Search CPC (representative US benchmarks)
Pay-Per-Click Advertising Cost; From WordStream/LocaliQ 2025 search data (US campaigns):
- High-CPC tier (roughly $6–$9):
- Attorneys & Legal Services: $8.58
- Dentists & Dental Services: $7.85
- Home & Home Improvement: $7.85
- Education & Instruction: $6.23
- Moderate-CPC tier (roughly $3.5–$6):
- Personal Services: $5.81
- Beauty & Personal Care: $5.70
- Industrial & Commercial: $5.70
- Business Services: $5.58
- Career & Employment: $5.16
- Health & Fitness: $5.00
- Physicians & Surgeons: $5.00
- Apparel / Fashion & Jewelry: $4.31
- Animals & Pets: $3.97
- Automotive — Repair, Service & Parts: $3.90
- Furniture: $3.86
- Shopping & Collectibles: $3.49
- Finance & Insurance: $3.46
- Low-CPC tier (roughly $1.6–$3):
- Automotive — For Sale: $2.41
- Real Estate: $2.53
- Sports & Recreation: $2.64
- Travel: $2.12
- Restaurants & Food: $2.05
- Arts & Entertainment: $1.60
Aggregated summary of competition tiers:
- High-competition verticals (Legal, Dental, Home Improvement, Education): CPC ≈ $6.23–$8.58 (tier avg ≈ $7.58).
- Moderate-competition (13 industries including Business Services, Health & Fitness, etc.): CPC ≈ $3.46–$5.81 (tier avg ≈ $4.69).
- Low-competition (e.g., Arts, Travel, Restaurants): CPC ≈ $1.60–$2.64 (tier avg ≈ $2.22).
Bing Ads (Microsoft Advertising) cost comparison (2026)
- CPC: ~$1.50–$2.80.
- CPM: ~$6–$9.
- CTR: ~2.8% on average.
Bing can be 30–40% cheaper than Google for many verticals, with somewhat lower volume.
Cross-platform CPM benchmarks
- Triple Whale (ecommerce-heavy Google Ads set, 2025): median CPM ≈ $12.79 (up ~10% YoY).
- Pixis ($996M spend, 100 consumer brands, 2024–2025): average Google CPM ≈ $11.12; ≈ $17.80 when adjusting for outliers; CPC ≈ $0.73; CTR ≈ 1.53% across Google’s mix (Search, Display, Shopping, PMax, Video).
- For context: Google Display Network (GDN) in these panels can be much cheaper (e.g., Display CPM ≈ $2.54), while brand-heavy search pushes average CPMs higher.
3. CTR by industry (what’s “normal” in 2026?)
From LocaliQ/WordStream 2025 search benchmarks:
- Overall average CTR for search ads: 6.66%.
Industry examples (average CTR):
- Arts & Entertainment: 13.10%
- Automotive — For Sale: 8.29%
- Finance & Insurance: 8.33%
- Health & Fitness: 7.18%
- Personal Services: 7.69%
- Animals & Pets: 6.58%
- Apparel / Fashion & Jewelry: 6.77%
- Attorneys & Legal Services: 5.97%
- Automotive — Repair, Service & Parts: 5.56%
- Business Services: 5.65%
- Career & Employment: 6.57%
- Dentists & Dental Services: 5.44%
- Education & Instruction: 5.74%
- Furniture: 6.11%
- Home & Home Improvement: 6.37%
- Industrial & Commercial: 6.23%
Practical benchmarks:
- Below 3–4% CTR on search: your relevance, targeting, or ad copy likely needs work.
- 6–8% CTR: healthy in many industries (aim for this).
- Above 10%: excellent, especially in competitive verticals.
4. CPM trends and why they matter
- Triple Whale: median CPM increased to $12.79 in 2025, up about 10% YoY; CPMs rose across all tracked industries.
- Pixis cross-Google report (incl. display, video, PMax): average Google CPM ≈ $11.12 (≈ $17.80 adjusted for outliers); CPC ≈ $0.73; CTR ≈ 1.53%.
- Bing Ads 2026: CPM ≈ $6–9; CPC ≈ $1.50–2.80; CTR ≈ 2.8%.
What this means for you:
- CPM matters for:
- Awareness-first campaigns (Display, YouTube).
- CPM-based buys (e.g., brand lift or reach).
- For direct-response/search campaigns, CPC and CPA matter more than CPM; use CPM as a secondary efficiency check.
5. Conversion rate and CPL benchmarks (so you can calculate “realistic” leads)
Pay-Per-Click Advertising Cost; From WordStream/LocaliQ 2025 search benchmarks (US):
- Average conversion rate for Google Ads (Search): 7.52% across industries.
- Average cost per lead (CPL): $70.11.
OwlClaw’s 2025 summary (WordStream-sourced) shows a broader set of CVRs by industry:
- Legal Services: 6.9%
- Finance & Insurance: 5.4%
- B2B / Professional Services: 4.5%
- Ecommerce / Retail: 3.2%
- Health & Medical: 3.0%
- Technology / SaaS: 2.8%
- Real Estate: 2.2%
- Travel & Hospitality: 2.0%
- Education: 2.1%
Use your own data first:
- “Good” CVR:
- Lead gen (B2B/professional services): often 3–6%.
- Ecommerce purchase: often 2–4% (can be higher with strong intent and smooth checkout).
6. How to set a realistic PPC budget in 2026
Pay-Per-Click Advertising Cost; Think in three steps: 1) estimate CPC for your industry, 2) apply a realistic conversion rate, 3) add management fees and a learning buffer.
Step 1: Anchor your CPC
Pick an initial CPC using benchmarks:
- Low competition (Arts, Restaurants, Travel): start near $2–3 per click.
- Moderate competition (Business Services, Health & Fitness, Apparel, Auto parts): start near $4–6 per click.
- High competition (Legal, Dental, Home Improvement, Education): start near $6–9 per click.
Step 2: Estimate clicks and leads
Example 1 — B2B service (moderate CPC ≈ $5, CVR 4.5%)
- Monthly media budget: $3,000
- Expected clicks: 3,000 ÷ 5 = 600 clicks
- Expected leads (at 4.5% CVR): 600 × 0.045 = 27 leads
- CPL: 3,000 ÷ 27 ≈ $111 per lead
Example 2 — Local legal services (high CPC ≈ $8, CVR 7%)
- Monthly media budget: $4,000
- Expected clicks: 4,000 ÷ 8 = 500 clicks
- Expected leads (at 7% CVR): 500 × 0.07 = 35 leads
- CPL: 4,000 ÷ 35 ≈ $114 per lead
Compare your CPL to your deal size and close rate:
- If your average customer value is $1,000 and you close 30% of leads:
- Value per lead ≈ $300.
- A $100–$120 CPL can work (healthy margin).
- If average customer value is $250 and you close 20%:
- Value per lead ≈ $50.
- That same CPL is too high; you must either lower CPC or increase CVR.
Step 3: Add management fees and a learning buffer
Management/agency fees:
- Typical management cost: ~10–20% of ad spend (or equivalent flat fee).lotiva+1
- Example: $3,000 media spend + 15% management = $3,450 total.
Learning/test budget:
- Reserve 15–25% of your budget for testing (creatives, audiences, offers) during the first 2–3 months. This reduces the “performance pressure” on early campaigns.
7. DIY budget worksheet you can use today
Pay-Per-Click Advertising Cost; Plug your own numbers into this simple worksheet:
- A) Target monthly media budget: $______
- B) Estimated CPC (use your industry’s range): $______
- C) Expected clicks = A ÷ B: ______ clicks
- D) Expected conversion rate (start with 3–7%): ____%
- E) Expected leads/sales = C × (D ÷ 100): ______
- F) Estimated CPL = A ÷ E: $______
Then compare F to your economics:
- G) Average revenue per customer: $______
- H) Lead-to-customer close rate: ____%
- I) Value per lead = G × (H ÷ 100): $______
- J) Target max CPL = I × (your acceptable profit share, e.g., 40–60%): $______
If F > J, you need to:
- Lower CPC (improve Quality Score, long-tail keywords, negative keywords).
- Raise conversion rate (better landing pages, forms, offers).
- Raise deal size or close rate (sales process, follow-up).
8. What is a “good” CPC, CTR, CVR for you?
Pay-Per-Click Advertising Cost; Rough targets for Search:
- Good CPC:
- At or below your industry median (e.g., ≤$5.5 in many moderate-competition verticals). Anything 20–30% below your vertical’s median is strong.
- Good CTR:
- 6–8% on search is healthy for many industries; below ~4% is usually a red flag unless your vertical has historically low CTR.
- Good CVR:
- B2B/professional services: 3–6% is common; top accounts can go higher.
- Ecommerce: 2–4% is a solid starting point; top brands can exceed 5–7% with strong intent and CRO.
9. Should you supplement Google with Bing/Microsoft in 2026?
Yes, if:
- You’re in higher-CPC verticals (legal, finance, home services) and want cheaper incremental clicks.
- Your audience skews older, desktop-based, or US/UK where Bing has meaningful share.
What to expect (2026):
- CPC: 30–40% cheaper than Google for many industries; ~$1.50–$2.80.
- CPM: ~$6–9.
- CTR: ~2.8%.
Use a similar budgeting approach on Bing, but expect lower volume.
10. Where “marketing keywords average $7.40+” fits in
Most of the benchmarks above are based on aggregated campaign data. Pay-Per-Click Advertising Cost; Keyword-level CPCs inside those campaigns can be far higher or lower:
- Aggregated studies show “average CPC across all industries” in the $2.69–5.26 range.
- Within those same accounts, head terms like:
- “marketing agency”, “CRM software”, “email marketing platform”, or
- “personal injury lawyer”, “commercial insurance”, “online MBA” commonly sit in the $7–$10+ CPC range — especially in competitive regions.
So if you see $7–$12 CPC on high-intent marketing/vertical keywords, that’s not necessarily “wrong” — it just means:
- You must justify that with high lead quality and deal size.
- Focus tightly on:
- Quality Score (relevance, CTR, landing page experience).
- Long-tail, lower-CPC variants that still convert.
- Tight geo/segmentation to avoid wasted spend.
11. Key 2026 planning checklist
Pay-Per-Click Advertising Cost; Before you spend, get these in place:
- Tracking:
- GA4 and conversion actions aligned with revenue (leads, purchases).
- Offline conversions where possible (closed-loop leads).
- Benchmarks for your industry:
- CPC and CTR ranges from the tables above.
- CVR and CPL from WordStream/LocaliQ/OwlClaw.
- Budgeting model:
- Monthly media budget.
- Expected CPC → expected clicks.
- Expected CVR → expected leads → estimated CPL.
- Compare CPL to your per-lead economic value.
- Management:
- Decide: DIY vs agency/freelancer, and add 10–20% of spend (or equivalent flat fee) if you hire help.
- Test buffer:
- 15–25% of budget for experiments in the first 60 days.
Pay-Per-Click Advertising Cost; If you share your industry, average deal size, and target monthly budget, I can plug your numbers into this framework and give you a concrete “clicks → leads → CPL” projection tailored to your vertical.


Leave a Reply