Boost efficiency with top inventory control systems! Streamline operations, reduce costs & track stock in real-time. Learn more!
Inventory Control Systems: 2025 Complete Guide
Boost efficiency with top inventory control systems! Track stock, reduce costs & streamline operations. Get started now!
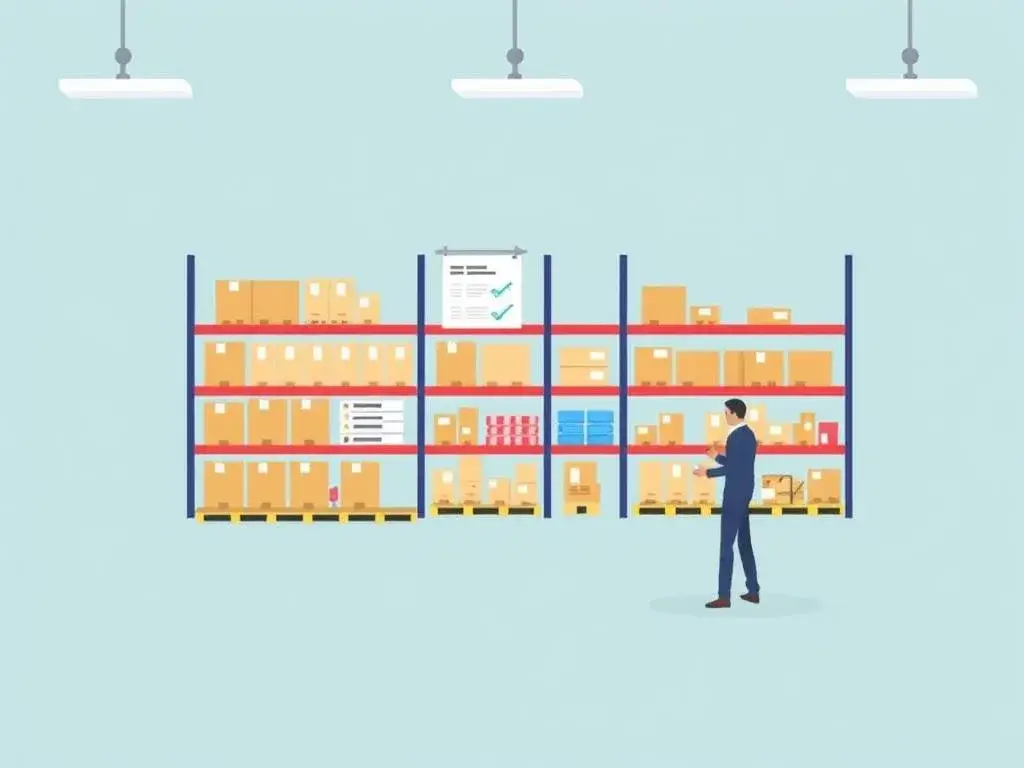
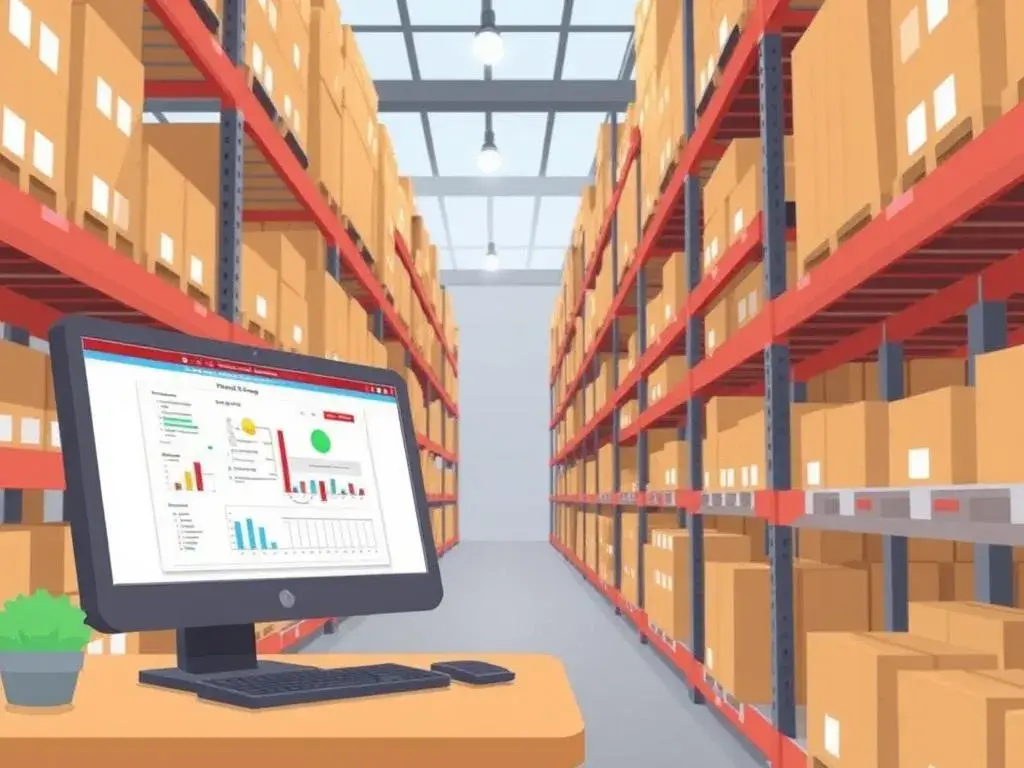
Inventory control systems are the technological backbone of modern supply chain management, transforming how businesses track, manage, and optimize stock levels. In 2025, these systems have evolved beyond simple tracking to become AI-powered, cloud-native platforms that drive profitability and operational excellence.
📊 Market Overview & 2025 Trends
Growth Trajectory
The global inventory management software market is experiencing robust growth with a CAGR of 8.1% from 2025 to 2031. Key drivers include:
- Supply chain efficiency demands: Post-pandemic resilience requirements
- Cloud adoption: 78% of businesses now use cloud-based inventory systems
- Real-time tracking needs: Omnichannel retail and same-day delivery expectations
- AI/ML integration: Predictive analytics reducing stockouts by 40%
Emerging Technologies Shaping 2025
| Technology | Impact | Adoption Rate |
|---|---|---|
| AI & Machine Learning | Predictive demand forecasting, automated reordering, anomaly detection | 65% of enterprise systems |
| Cloud-Based Solutions | Real-time visibility, multi-location synchronization, reduced IT costs | 78% of businesses |
| IoT-Enabled Tracking | Live stock monitoring, automatic replenishment triggers, theft prevention | 52% of warehouses |
| Omnichannel Management | Unified inventory across online/offline channels, click-and-collect optimization | 83% of retailers |
| Warehouse Automation | Robotics integration, AI-driven slotting, autonomous guided vehicles | 41% of large facilities |
🏗️ Types of Inventory Control Systems
4 best Types of Inventory Control Systems
1. Periodic Inventory System
Definition: Physical counts conducted at scheduled intervals (monthly, quarterly) to track stock levels.
Pros: Simple, low-cost, suitable for small inventories Cons: No real-time data, risk of stockouts between counts, labor-intensive
Best For: Small businesses with limited SKUs, low-value items
2. Perpetual Inventory System
Definition: Continuous real-time tracking where inventory updates instantly with each transaction.
Pros: Real-time visibility, accurate stock levels, automatic reordering Cons: Requires technology investment, complex setup
Best For: Medium to large businesses, high-value items, omnichannel retailers
3. Just-in-Time (JIT) System
Definition: Inventory arrives exactly when needed for production/sales, minimizing holding costs.
Formula: Reorder Point = Lead Time Demand + Safety Stock
Pros: Reduces carrying costs, frees up warehouse space, improves cash flow Cons: Vulnerable to supply chain disruptions, requires reliable suppliers
Example: Toyota produces cars only after receiving customer orders, with parts arriving hours before assembly
4. ABC Analysis System
Definition: Categorizes inventory into three classes based on value and importance.
Formula:
- A Items: Top 10-20% of SKUs (70-80% of value) – Tight control, monthly counts
- B Items: Next 20-30% of SKUs (15-25% of value) – Moderate control, quarterly counts
- C Items: Bottom 50-60% of SKUs (5-10% of value) – Simple control, annual counts
Example: Electronics retailer categorizes:
- A: iPhones (10% of SKUs, 75% of revenue) – Daily tracking
- B: Headphones (25% of SKUs, 20% of revenue) – Weekly tracking
- C: Phone cases (65% of SKUs, 5% of revenue) – Monthly tracking
📋 2025 Best Practices: In-Depth Guide
How Do Inventory Control Systems Improve Efficiency?
1. ABC Analysis (Pareto Principle)
Implementation Steps:
- Calculate Annual Consumption Value: Unit Cost × Annual Demand
- Rank Items: Sort by consumption value (highest to lowest)
- Classify:
- A: Top 10-20% (70-80% value)
- B: Next 20-30% (15-25% value)
- C: Bottom 50-60% (5-10% value)
- Apply Controls:
- A Items: Weekly cycle counts, tight security, frequent forecasting
- B Items: Monthly counts, standard controls
- C Items: Quarterly/annual counts, simple reorder rules
Benefits: Focuses 80% of management effort on 20% of items that generate most value
2. FIFO (First-In, First-Out)
Implementation:
- Label everything: Clear date marking on all receipts
- Physical arrangement: Place older stock at front, newer at back
- Team training: Ensure all staff understand rotation procedures
- Regular audits: Verify FIFO compliance during cycle counts
Best For: Perishable goods (food, pharmaceuticals), items with expiration dates, electronics (obsolescence risk)
3. Economic Order Quantity (EOQ)
Formula:EOQ = √[(2 × D × S) ÷ H]
Where:
- D = Annual demand (units)
- S = Ordering cost per order ($)
- H = Holding cost per unit per year ($)
Example: Retailer sells 1,000 units/year of a product. Ordering cost is $50/order, holding cost is $2/unit/year.EOQ = √[(2 × 1,000 × 50) ÷ 2] = √[100,000] = 316 units
Interpretation: Order 316 units per order to minimize total inventory costs
Adjustments: Recalculate EOQ quarterly for seasonality, demand changes, supplier cost changes
4. Real-Time Inventory Tracking
Technology Stack:
- Barcode scanners: $50-$200 per device
- RFID tags: $0.10-$0.50 per tag (passive), $20-$50 (active)
- IoT sensors: Monitor temperature, humidity for perishables
- Cloud WMS: Real-time sync across all channels
Implementation:
- Start with critical SKUs: Don’t track everything at once
- Integrate systems: Connect POS, e-commerce, warehouse management
- Set up alerts: Automatic notifications at reorder points
- Train staff: Ensure scanning protocols are followed
ROI: Companies using real-time tracking reduce stockouts by 40% and carrying costs by 25%
5. Safety Stock Management
Formula:Safety Stock = (Maximum Daily Sales × Maximum Lead Time) - (Average Daily Sales × Average Lead Time)
Example: Product sells 10 units/day average, but up to 15 units/day during peak. Supplier delivers in 5 days average, but up to 8 days during disruptions.Safety Stock = (15 × 8) - (10 × 5) = 120 - 50 = 70 units
Service Level Approach: For 95% service level, use z-score (1.65)Safety Stock = Z-score × Standard Deviation of Demand × √Lead Time
Best For: Critical items, variable demand/supply, high stockout costs
6. Cycle Counting & Physical Audits
Implementation:
- ABC-based frequency:
- A items: Count monthly (12×/year)
- B items: Count quarterly (4×/year)
- C items: Count annually (1×/year)
- Schedule during low activity: Minimize operational disruption
- Train counters: Ensure consistency in counting methods
- Investigate discrepancies: Root cause analysis for variances >2%
Best For: High-value items, regulated industries (pharma, aerospace), large warehouses
7. Inventory Forecasting & Demand Planning
Methods:
- Moving Average: Average of last 3-6 months (simple, stable demand)
- Weighted Moving Average: Recent months weighted higher (trending demand)
- Exponential Smoothing: Adjusts for trends and seasonality
- Machine Learning: AI analyzes multiple variables (promotions, weather, economic indicators)
Best For: Seasonal products, promotional items, new product launches
8. Supplier Relationship Management & Diversification
Strategies:
- Maintain 2-3 suppliers for critical SKUs → reduces single-source risk
- Use SLAs and scorecards: Track delivery performance, quality, lead times
- Negotiate volume discounts: Leverage purchase history for better terms
- Collaborative planning: Share forecasts to secure priority during shortages
Best For: Global sourcing, manufacturing, just-in-time operations
9. Warehouse Organization & Layout Optimization
Principles:
- Fast movers near packing: Place high-velocity items closest to shipping area
- ABC zone layout: A items in most accessible zones, C items in harder-to-reach areas
- Clear labeling: Barcodes, RFID tags, visual cues for pickers
- Regular layout reviews: Analyze pick paths quarterly to identify inefficiencies
Best For: Fulfillment centers, e-commerce warehouses, distribution centers
📊 Best Practices Comparison Table
What Are the Best Inventory Control Systems Available?
| Method | Implementation Complexity | Resource Requirements | Effectiveness | Ideal Use Cases | Key Advantages |
|---|---|---|---|---|---|
| Just-In-Time (JIT) | High – tight supplier coordination | Moderate-High (ERP/WMS, reliable suppliers) | ⭐⭐⭐⭐ | Manufacturing, automotive, stable suppliers | Reduces carrying costs, improves cash flow |
| ABC Analysis | Low-Moderate | Low (valuation data, basic analytics) | ⭐⭐⭐⭐ | Retail, pharma, manufacturing | Focuses effort on high-value items |
| FIFO | Low (procedural) | Low-Moderate (labeling, training) | ⭐⭐⭐⭐ | Food & Beverage, pharma, grocery | Prevents spoilage/obsolescence |
| EOQ | Moderate (formula-based) | Low-Moderate (cost data, simple software) | ⭐⭐⭐ | Steady-demand manufacturing | Minimizes ordering/holding costs |
| Real-Time Tracking | High (system integration) | High (RFID, IoT, WMS) | ⭐⭐⭐⭐⭐ | Large retailers, high-volume warehouses | 40% fewer stockouts, 25% lower carrying costs |
| Forecasting | High (modeling, refinement) | Moderate-High (data, analytics tools) | ⭐⭐⭐⭐ | Seasonal retail, manufacturing | Reduces excess inventory by 30% |
| Safety Stock | Moderate (statistical) | Low-Moderate (extra inventory) | ⭐⭐⭐ | Healthcare, variable lead times | Prevents stockouts during disruptions |
| Cycle Counting | Moderate (procedures, scheduling) | Low-Moderate (labor, mobile devices) | ⭐⭐⭐⭐⭐ | Retail, warehouses, pharma | Detects discrepancies early |
| Supplier Diversification | Moderate-High (contracts, management) | Moderate (procurement resources) | ⭐⭐⭐⭐ | Global sourcing, manufacturing | Reduces single-source risk |
| Layout Optimization | Moderate-High (design, possible disruption) | Moderate-High (racking, automation) | ⭐⭐⭐⭐ | Fulfillment centers, e-commerce | Faster picks, better space use |
💡 Implementation Roadmap
How to Implement an Effective Inventory Control Systems
Phase 1: Foundation (Months 1-3)
- Conduct ABC analysis: Classify all SKUs
- Implement FIFO: For perishable items
- Set up cycle counting: Start with A items
- Choose inventory management software: Select based on business size
Cost: $500-2,000 (software setup, training)
Expected ROI: 15-25% reduction in carrying costs
Phase 2: Optimization (Months 4-6)
- Implement EOQ: For stable-demand items
- Establish safety stock levels: For critical items
- Launch supplier scorecards: Track performance
- Optimize warehouse layout: Based on ABC zones
Cost: $1,000-3,000 (process changes, layout adjustments)
Expected ROI: 20% reduction in stockouts, 10% faster picks
Phase 3: Automation (Months 7-12)
- Deploy real-time tracking: Barcode/RFID for critical SKUs
- Enable demand forecasting: Use ML-based predictions
- Integrate IoT sensors: For temperature-sensitive goods
- Implement JIT for non-critical items
Cost: $5,000-15,000 (hardware, software upgrades)
Expected ROI: 40% fewer stockouts, 25% lower carrying costs
💰 ROI & Cost-Benefit Analysis
Investment Breakdown (Small Business, 100 SKUs)
| Category | Initial Cost | Annual Cost | Savings/Year | ROI |
|---|---|---|---|---|
| Software | $500 | $600 | – | – |
| Barcode Scanners | $400 | $0 | – | – |
| Training | $300 | $0 | – | – |
| Total Investment | $1,200 | $600 | – | – |
| Savings | – | – | $3,500 | 292% |
Quantified Benefits :
- 40% reduction in stockouts → Saves $2,000 in lost sales
- 25% lower carrying costs → Saves $1,500 in warehouse/storage fees
- 30% less excess inventory → Saves $1,000 in obsolescence write-offs
- 15% faster order fulfillment → Improves customer satisfaction, repeat purchases
Payback Period: 4-6 months for typical small business implementation
⚠️ Common Pitfalls & Solutions
| Pitfall | Consequence | Solution |
|---|---|---|
| No ABC analysis | Wasted effort on low-value items | Classify SKUs and focus on A items first |
| Ignoring seasonality | Stockouts in peak, excess in off-season | Use ML-based forecasting that includes seasonality |
| Static safety stock | Overstock in stable periods, stockouts in volatility | Recalculate safety stock monthly based on demand variability |
| Manual tracking | Errors, outdated data, no real-time visibility | Implement barcode/RFID scanning with cloud WMS |
| Poor supplier management | Late deliveries, quality issues, stockouts | Use supplier scorecards and maintain 2-3 vendors per critical SKU |
| Not training staff | Inconsistent processes, data entry errors | Conduct quarterly training on counting procedures and system usage |
🎯 2025 Technology Selection Guide
For Small Business (50-500 SKUs, $0-5K budget)
Recommended Stack:
- Software: Zoho Inventory ($39/month) or inFlow Inventory ($71/month)
- Hardware: $200 barcode scanner, existing smartphones for scanning
- Practices: ABC analysis, FIFO, cycle counting, EOQ for top 20% of SKUs
- Expected ROI: 200-300% within 6 months
For Mid-Size Business (500-5K SKUs, $5K-20K budget)
Recommended Stack:
- Software: Cin7 ($349/month) or Unleashed ($259/month)
- Hardware: $2,000 RFID system, tablets for warehouse staff
- Practices: Real-time tracking, safety stock management, demand forecasting, supplier diversification
- Expected ROI: 150-250% within 12 months
For Enterprise (5K+ SKUs, $20K+ budget)
Recommended Stack:
- Software: NetSuite WMS, SAP Integrated Business Planning, or Brightpearl
- Hardware: $15,000+ IoT sensors, autonomous mobile robots, integrated conveyors
- Practices: AI-driven forecasting, JIT across supply chain, omnichannel inventory, automated replenishment
- Expected ROI: 100-200% within 18-24 months
🏁 Conclusion: 2025 Action Plan
Start Today:
- ABC Analysis: Classify your SKUs this week (takes 2-4 hours)
- Choose Software: Free trial of Zoho Inventory or inFlow
- Implement FIFO: For perishables/time-sensitive items
- Set Reorder Points: Use EOQ formula for top 10 SKUs
- Track Results: Measure stockout frequency, carrying costs, order fulfillment time
Success Metrics (track monthly):
- Stockout Rate: Target <2% of SKUs per month
- Inventory Turnover: Target improvement of 20% year-over-year
- Carrying Cost: Target reduction of 15-25%
- Order Accuracy: Target >98% fulfillment accuracy
Remember: The best inventory control system is one you’ll actually use. Start simple, scale gradually, and continuously refine based on data.


Leave a Reply