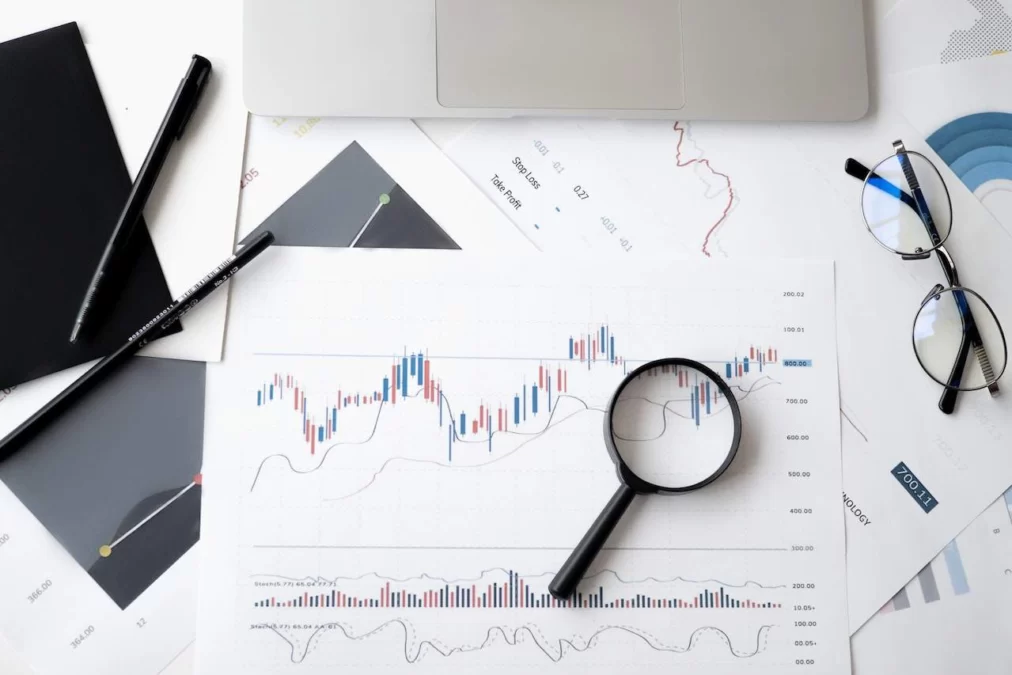
The Essential Guide to Supply and Demand Analysis in Forex Trading. Do you ever wonder how to make sense of the graphs, candlesticks, and charts in commodities brokers’ offices or on financial websites? Are you curious about learning the art of analyzing supply and demand conditions so that profitable trades can be executed? If you answered “yes” to either of those questions, then this blog post is for you!
How to Use Supply and Demand Analysis in Forex Trading
In it, I’m going to explain what supply and demand analysis is in forex trading – including its importance. As well as provide a step-by-step guide on how beginners can begin utilizing this strategy in their daily trading. You can also find great tips on this topic at fundedtraderplus.com. If you’re ready to uncover some incredible new possibilities through understanding supply and demand analysis, keep reading!
Understand the Basics of Supply and Demand Theory
When it comes to understanding the workings of the market, the concept of supply and demand theory is crucial. This economic theory essentially boils down to the idea that the price of goods and services is determined by the balance between how much of them are available (supply) and how much people want them (demand).
The higher the demand for an item, the more valuable it becomes, and the more suppliers can charge for it. Understanding this concept is essential for anyone hoping to succeed in business. As it helps them to predict market trends and stay ahead of the competition. By mastering the basics of supply and demand theory, you can stay ahead of the game and ensure you are making smart investments and strategic business decisions.
Identify Key Support and Resistance Levels
The financial market can be complex and unpredictable. However, identifying key support and resistance levels can give traders a competitive edge. Support levels are price levels where demand for security is strong enough to prevent it from falling further. Resistance levels are price levels where selling pressure is strong enough to prevent the security from rising further.
By identifying these crucial levels, traders can make informed decisions about when to buy or sell to maximize profits and minimize losses. Some key factors to consider when identifying support and resistance levels include price history, trendlines, and trading volume. As with any investment strategy, there are risks involved, but with careful analysis and diligence. Traders can use support and resistance levels to make more informed and confident trades.
Analyze Price Movement to Find Opportunities
In the world of trading, one of the most important skills is the ability to analyze price movements to find lucrative opportunities. This involves studying trends, patterns, and indicators to predict how the market will behave.
By analyzing historical data, traders can identify patterns and then use this information to make informed investment decisions. However, it’s important to remember that trading is always a risk since no one can predict the future with complete accuracy. Nonetheless, by utilizing the right tools and strategies, traders can stay ahead of the game and capitalize on opportunities as they arise.
Utilize Fundamental Analysis to Make Trading Decisions
As a trader, you know that making informed decisions is key to your success. This is where fundamental analysis comes in. By analyzing economic and financial factors that impact a particular market. You can gain insight into whether an asset is undervalued or overvalued and make more informed trading decisions.
For example, understanding a company’s financial statements, its competitors, and its industry can help you evaluate its long-term prospects and make better-informed decisions about buying or selling its stock. While there is no guarantee of success, utilizing fundamental analysis can help you make more informed trading decisions and improve your chances of success.
Use Technical Indicators & Chart Patterns to Help Forecast Price Changes
As an investor or trader, understanding how to predict price changes is a key skill. Fortunately, there are tools available that can help make forecasting easier. Technical indicators and chart patterns are two such tools. Technical indicators are mathematical calculations that use historical price and volume data to identify potential trends. Chart patterns, on the other hand, are visual representations of price movements that can help you identify areas of potential support and resistance. Utilizing these tools can help you make more informed trading decisions and potentially increase your returns.
Apply Risk Management Principles When Trading in the Forex Market
The Forex market is undoubtedly one of the most volatile markets out there. As such, trading in this market could result in substantial profits or significant losses, depending on how well you manage your risks. That’s why applying risk management principles is crucial in Forex trading. Risk management involves identifying, assessing, and prioritizing risks while implementing strategies to minimize or eliminate them.
By doing so, traders can protect their accounts against sudden market fluctuations and adverse events, ultimately increasing their chances of success. It’s therefore essential to consider thoroughly evaluating the market’s risks and creating a risk management plan before making any trades. By taking proactive measures and implementing sound risk management strategies. You can navigate the Forex market with more confidence and increase your chances of success.

Summary
Supply and demand are critical aspects of forex trading. By understanding the basics of this theory, traders can identify key support and resistance levels, find potential opportunities through analyzing price movements, apply fundamental analysis to make trading decisions, use technical indicators and chart patterns to help forecast market directions, and apply risk management principles while trading in the forex market.
These strategies are effective ways to take advantage of supply and demand in the forex market. Over time as you continue to learn the basics of forecasting market movements, develop technique-specific approaches that work best for you. When used properly, the utilization of supply and demand theory will help empower traders to gain insight into the ever-changing dynamics of currency exchange rates and make data-driven decisions when choosing their trading positions.


Leave a Reply